Published
on
October 24, 2018
| 2,310 views
| 3 followers
members are following updates on this item.
 All too often, we'll set goals and metrics, and don't find the time to check on them. As we enter the final quarter of the year, it's important to check in on your goals for your digital workplace. What milestones did you hit? What areas did you launch? What's been happening, and how have you been measuring it? Your Igloo provides three different methods of finding data on how much your digital workplace is being used, what areas are the most active, and which members are doing the most work.
Previously, we examined the kinds of goals you might set for your digital workplace, like driving engagement with announcements, or measuring average time on pages. Looks at daily traffic offer a perspective on how your Igloo is integrated into people's routines, and can offer insights into how much of their workday they spend there. Whatever your goals, today we'll focus on using each of the analytics features in Igloo to check in on them.
 Workplace Analytics
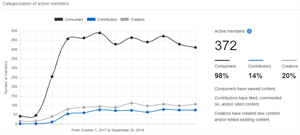
The Workplace Analytics Dashboard is an excellent way to check in on the activity of your digital workplace, including the most active members and solutions, but the other tabs offer deeper dives. Use the Categorization of active members area to monitor changes in people's habits. Are more people becoming contributors or creators as they grow into your Igloo? That's the place to find out.
The Activity tab provides insight into engagement trends in your digital workplace, and the Leaderboard offers opportunities to see which members are shining. The first few people will likely be your administrators, but fourth through sixth place can shift more readily. Are new people taking on a more significant role in your Igloo? Workplace analytics can be an invaluable resource for finding information specific to members, solutions, and content types.
The Google Analytics integration offers some incredible utilities for checking on traffic and searches. While it can't differentiate between content types, it offers easy to build dashboards and the ability to set and track goals. You can construct dashboards to view traffic from particular origins, track searches performed in your digital workplace, and check in on the behaviour of the average person. Google is always adding functionality and tutorials to Google Analytics, and these features integrate seamlessly with your Igloo.
Data Feeds offer the most comprehensive look into activity in your digital workplace. Once you've set goals, we recommend pulling in the relevant information with a Microsoft Power BI query, which offers options to visualize the data in a variety of ways. You'll be able to save it as a template as well, letting you easily reload and refresh the query when you want to see how things have changed. Find information on activity, versions, likes and other interactions, and even month by month activity reports in your Igloo's Data Feeds, and cross reference that data any way you need to to address specific questions and goals.
Setting and checking on goals is the best method of evaluating the health and engagement of your digital workplace. You'll be able to identify areas where people are struggling and where they're thriving, and use the lessons learned to build a better community for everyone.
If you have other questions about analytics, workflows, or best practices, you can leave a comment here, consult the Analytics Knowledge Base, or ask a question in the Community area.
2 Comments
Hi Jim Tigwell ,
Can you give some examples of popular or common queries for companies leveraging the Igloo Data feeds?
We've gotten comfortable with our Google and Workplace analytics and are ready to delve into data feeds, but aren't really sure where to start.
Thanks!
Absolutely. Here are some examples from our Analytics KB, complete with some downloadable Power BI templates: https://customercare.igloosoftware.com/support/analytics/data_feeds__examples