Last Updated:
June 16, 2021
by
Jesse Langstaff
| Version: 15
| 3,469 views
| 1 follower
members are following updates on this item.
The Salesforce Lead Conversion Integrations widget provides a portal into your Salesforce environment which shows a displaying the number of leads that have been converted into opportunities.
The Salesforce integration widgets provide many of the features available in the Salesforce web interface:
You can view the total number of leads from your selected sources.
You can select whether to view the information in a line graph or bar graph format.

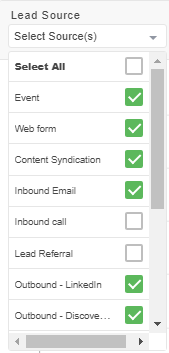
A dropdown is available to toggle which lead sources to include in the graph
You can switch between viewing the graphs in cumulative and non-cumulative views.
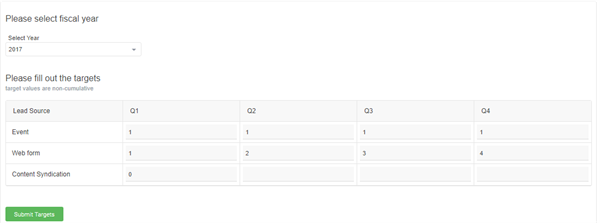
If your Salesforce account has administrator privileges, you can set target values by quarter for each of the opportunity stages.
Salesforce integration widgets require CORS to be enabled in your Salesforce instance. To enable CORS, see Salesforce - Enabling CORS.
Add an Integrations widget to your page.
Edit the widget and select the Salesforce Lead Conversion option from the list.
Enter the full URL for your Salesforce instance. Ex. https://na34.salesforce.com
Use the dropdown to select whether you are connecting to a production or sandbox instance of Salesforce.
Selecting Advanced Options will expand a list of additional features. You can enable or disable them as appropriate.