Published
on
April 18, 2018
| 2,536 views
| 1 follower
members are following updates on this item.
 As your digital workplace grows broader, including more Pages and Spaces, departments and offices, it can be a challenge to find which areas people are using. Finding Spaces with low activity or engagement is often the first step in a conversation about how to configure the platform to add value for your team. Similarly, Spaces with lots of activity are often exemplary, and can be excellent models for other areas in your Igloo.
There are three key analytics tools available in the Igloo platform, and today we'll go over how to pull detailed Space analytics from each. They have advantages and disadvantages, and work together in tandem to tell you everything you could ever want to know.
 Google Analytics
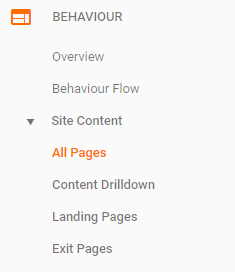
The Google Analytics integration makes it easy to find hotspots in a particular Space. Under Behaviour -> Site Content -> All Pages, you can find an overview of the views and time on page for everything in your digital workplace. The search option lets you filter those results by url, so entering the url path of the front of the Space will pull back that and everything underneath it. From there, you can sort by the number of views, or dig deeper into an individual item.
One of the other advantages of using Google Analytics to trace Space activity is that the Navigation Summary feature can tell you how people are navigating to the Space. Are they moving between areas in a project space? Always coming in from outside? Being drawn into social areas from your broader blogs or microblogs? The Navigation Summary goes much deeper than how many people use the space. It can tell you the sahpe of their activity directly.
 Workplace Analytics
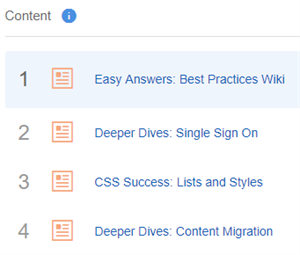
The Workplace Analytics function offers a quick insight into Space activity, under the Top Content tab. There it ranks the twenty most active Spaces or Solutions, displaying total views, likes, ratings and comments. These aren't actions that Google Analytics can distinguish, so the Top Content view gives you deeper insight into how people are using the Space, and the level to which they're engaging with content. This can be especially useful when Spaces are organized by content type, like a Newsroom Solution or a set of Q&A forums. Narrowing the content type makes it easier to set engagement goals and use Workplace Analytics to track outcomes.
All of the information you could ever want about Spaces is included in your digital workplace's datafeeds. It includes every member, and what action they took on each specific area of that Space, from looking at blog posts to liking forum topics. However, the information can be spread out over a number of tables, so it's best to have a specific question in mind when crafting a query. The space_key column has a number that will let you join individual pieces of content to a particular Space, and is invaluable in focusing your queries in Excel, Power BI, or your data management tool of choice.
The datafeeds also include several aggregate tables, including RptCommunitySpace and RptCommunitySpaceMonth, which offer an look at a Space's performance over time. The former table shows the total activity in the Space over the past year, and the latter breaks it down on a month by month basis, making it easy to track activity in a Space after its launch.
Having solid data on Space activity can be an excellent measure of engagement, and can serve as an easy way to track your goals, especially for Igloos that organize Spaces by department or location.
If you have questions about the analytics, workflows, or best practices, you can leave a comment here, or ask a question in the Community area.