Published
on
May 16, 2018
| 2,114 views
| 3 followers
members are following updates on this item.
 Finding areas and items that are abuzz with activity is easily the most popular question around analytics. We want to know what's doing well, what's driving engagement, and who's doing it. But it can be incredibly useful to your growth and engagement plan to track areas that see little to no traffic. This can help identify needs in your organization, and offer insight into areas of improvement.
Datafeeds makes it simple to rank your Spaces or Solutions by activity. The RptCommunitySpace table has a record of every single one in your Igloo, and contains activity information for the past year. The default sort is highest to lowest, but reversing that ranking will show you what team or project areas are struggling. The table totals activity, and also shows it by category, dividing actions into work, views, comments, likes, and ratings.
Not all things are Spaces, however. You may want to find articles, Pages, or other areas with low activity, and Google Analytics can help with this. The All Pages report in the Site Content section of the Behaviour tab offers an overview into the activity of every single article or file in your digital workplace. These results can be ordered by page views, but the lowest ranked ones will likely be system and administration page. That's where the Advanced Search comes in.

There are a few parameters worth excluding, in order to clean up the search and get the results you need. Selecting the Advanced option will let you refine the search. Creating the following rules will help.
The final filter should look like this:
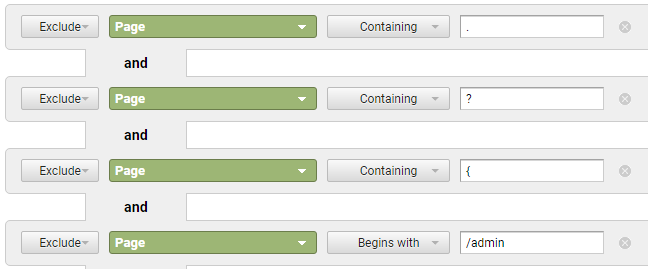
What remains should be all of the Pages, Spaces, articles and files that members visit. You can refine your search further to focus on networks of Pages, specific channels, or anything else you need. However, while Google Analytics will capture items with low activity, it won't capture things with no activity. If items are absent from the list, it's possible that no one has visited them in the time scale that's been set.
Once you've located the dead zones in your Igloo, you're equipped to address them. That might mean reaching out to teams to find out how their area can meet their needs, and providing training or resources where necessary. It may mean organizing, archiving, or deleting content that's no longer in use, which can help clean up search results and content creation options for members.
If you have questions about analytics, the Igloo platform, workflows, or best practices, you can leave a comment here, or ask a question in the Community area.
1 Comment
Jim:
This is good stuff. I am looking to create two reports using google analytics and/or oData feed into Excel. The first report is to capture usage data on files only that are stored in my community. I want to see when the last time the document was viewed and modified.
The second is a report that can capture all the archive or pending archive documents stored in my community so I could pull the report periodically and send out to my community stakeholders. Could you provide me with the tables and maybe parameters I would need to pull these 2 reports?
Thank you,
Jenine